Log your journey
through the cosmos
The ultimate imaging log for serious astrophotographers. Integrated with SIMBAD, track your sub-exposures, and optimise integration time.
Inside StellarLog
Experience the most advanced astronomy tracking interface ever built for mobile.
Precision Imaging Features
Tools designed for serious astrophotographers.
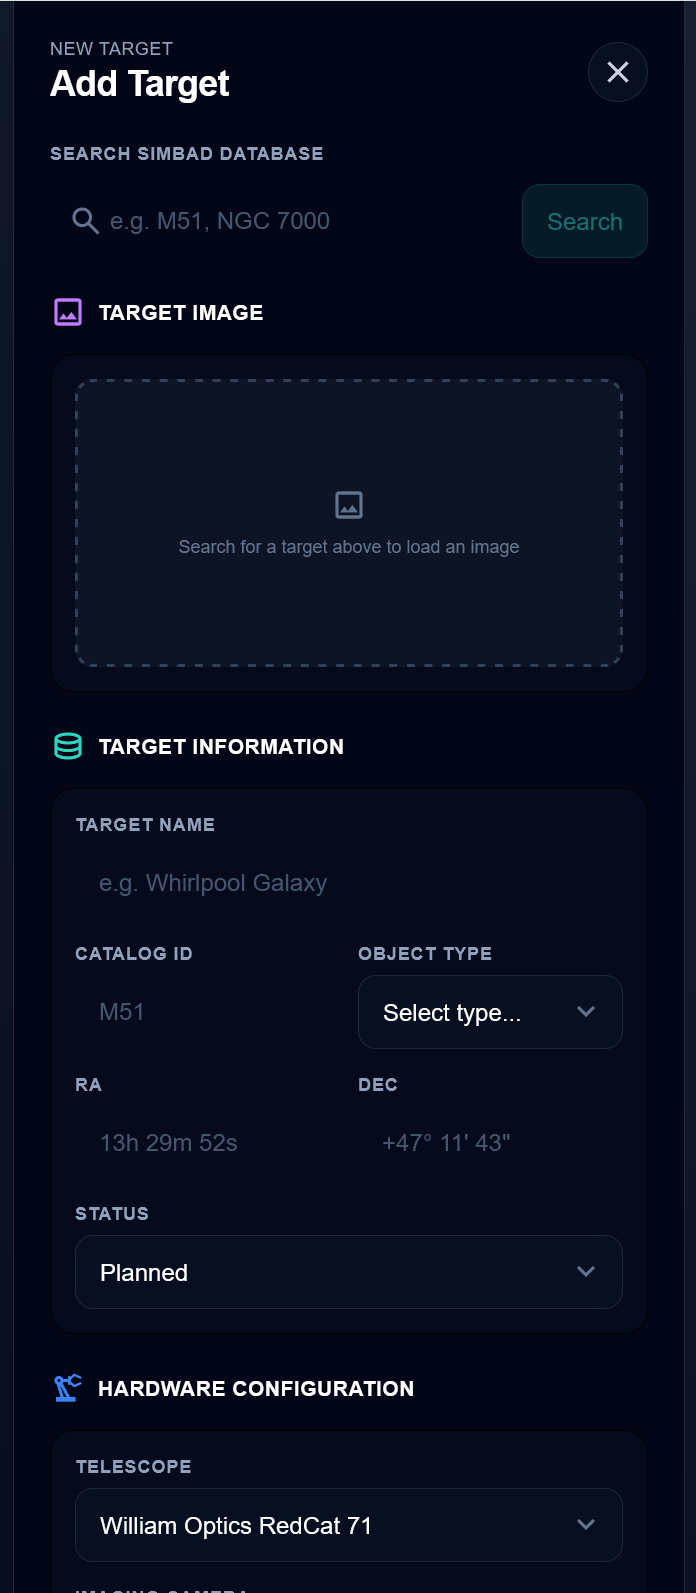
SIMBAD Integration
Search millions of astronomical objects instantly from the SIMBAD astronomical database. One-tap population of target coordinates, magnitude, object type, and angular size directly into your session log. No more manually copying coordinates or second-guessing catalogue IDs. Just search, confirm, and start imaging.
Mono Filter Tracking
Log sub-exposures across L, R, G, B, Ha, OIII, and SII filters with dedicated per-filter goal tracking. Visualise your integration progress for each channel at a glance, so you always know exactly which filters need more data before you can produce perfectly balanced master frames.
Night Mode Native
A true deep-red interface designed to preserve your dark adaptation while you're in the field. Every screen, button, and input is optimised for night vision preservation. No bright flashes, no white elements sneaking through. Just a fully red-shifted UI that lets you log sessions without ruining your vision.
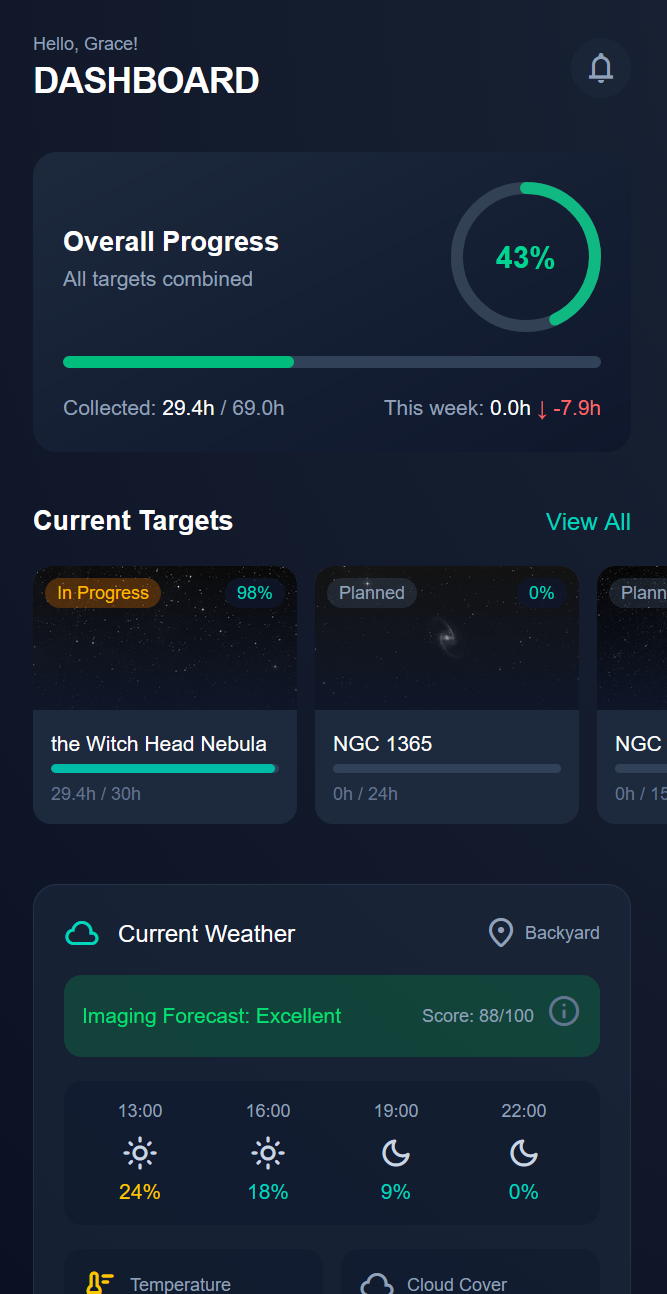
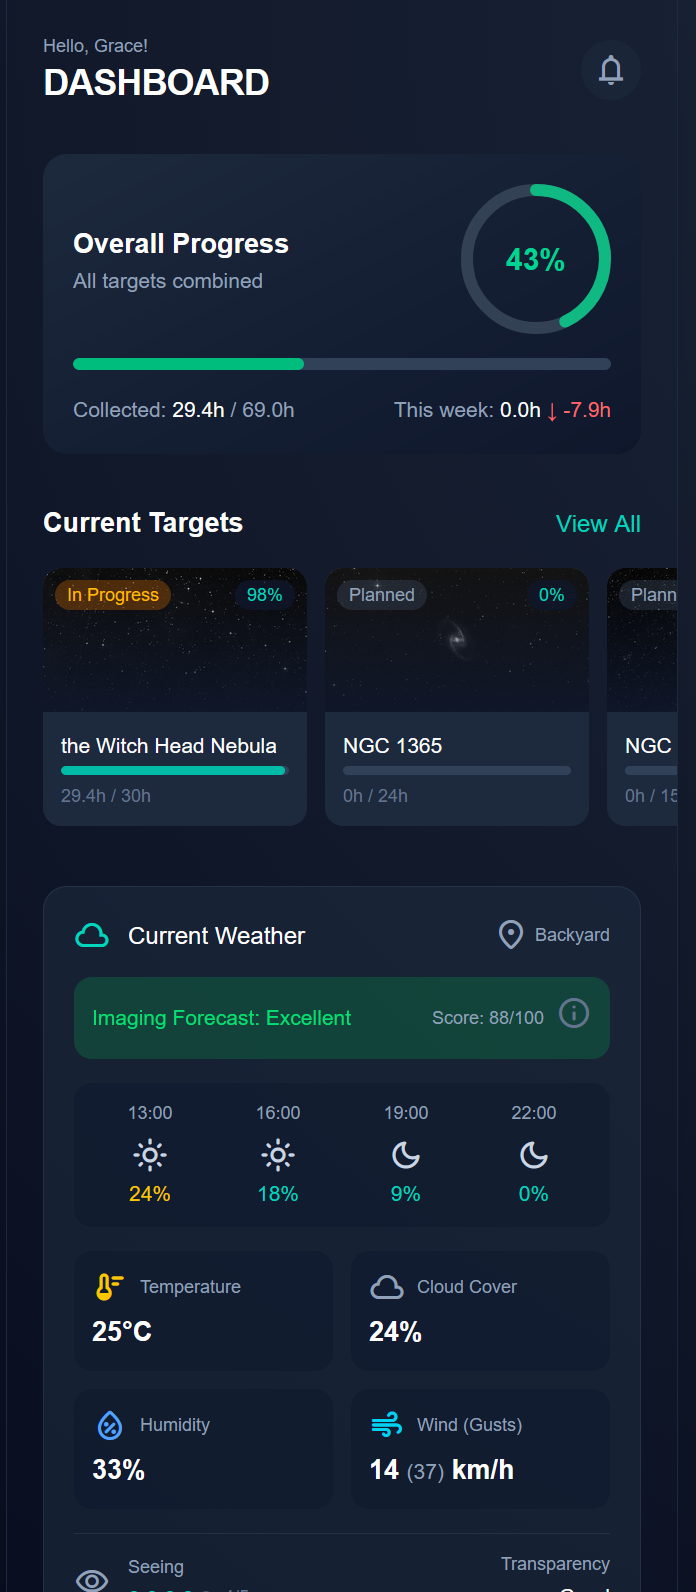
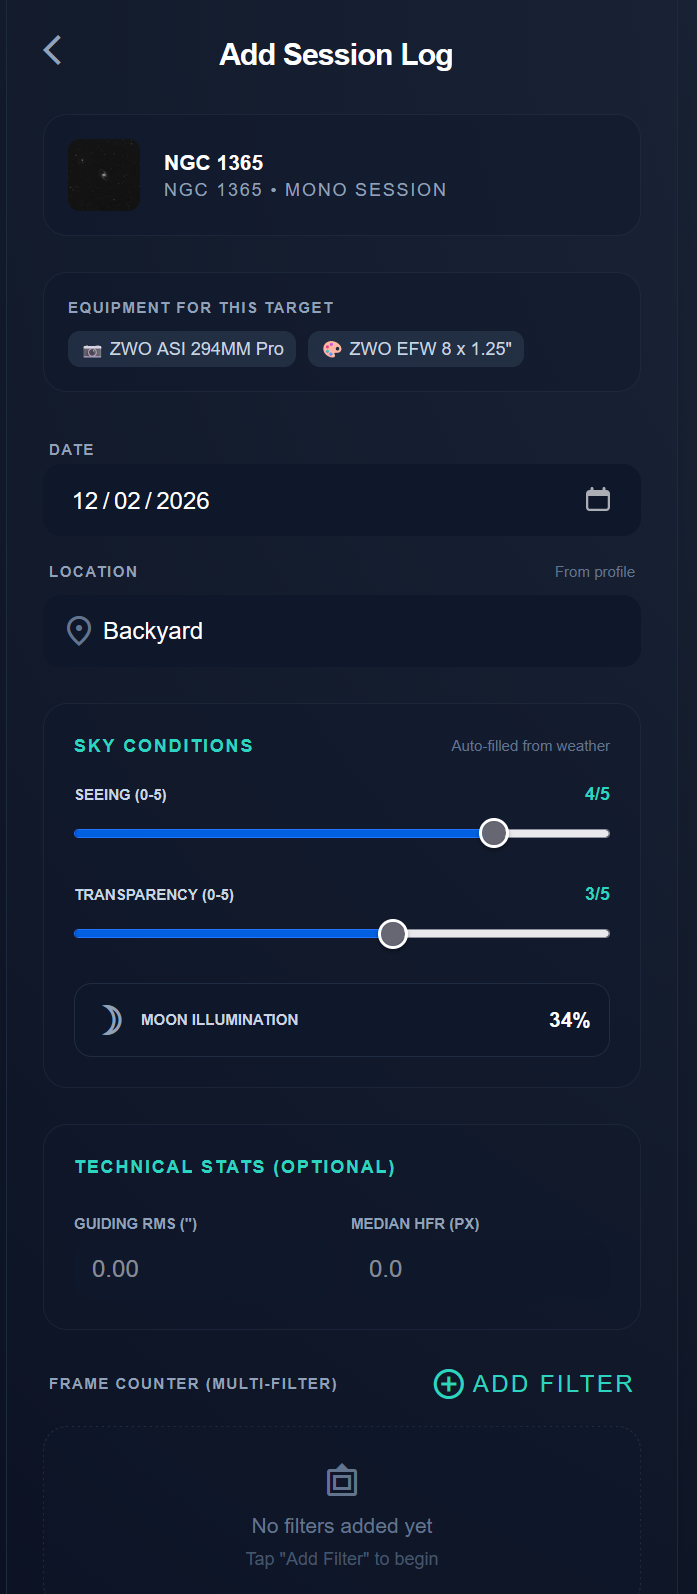
Weather Integration & Imaging Prediction
Real-time weather data pulled directly into your session logs, no manual entry needed. StellarLog's imaging forecast algorithm combines cloud cover, seeing, transparency, humidity, and moon phase to generate a nightly imaging score, so you always know whether it's worth setting up.
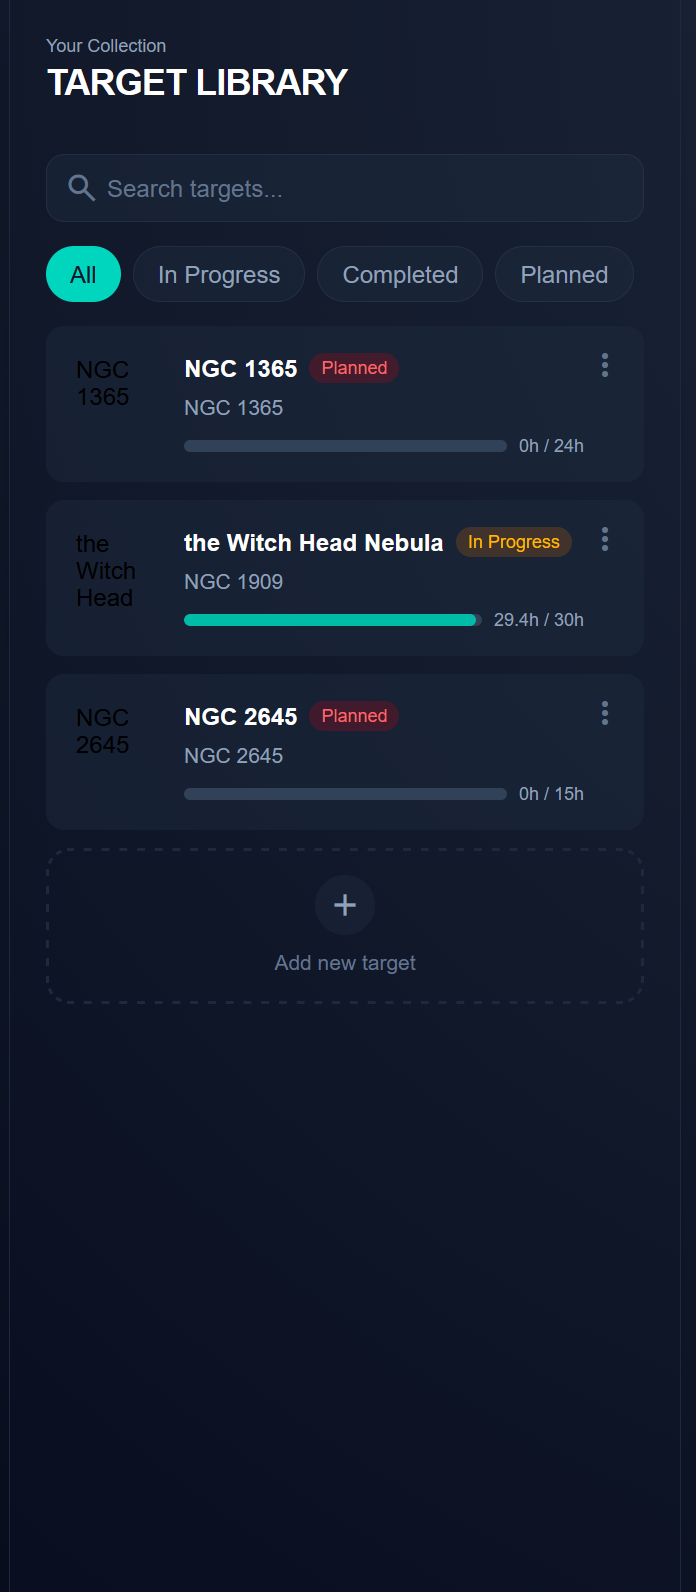
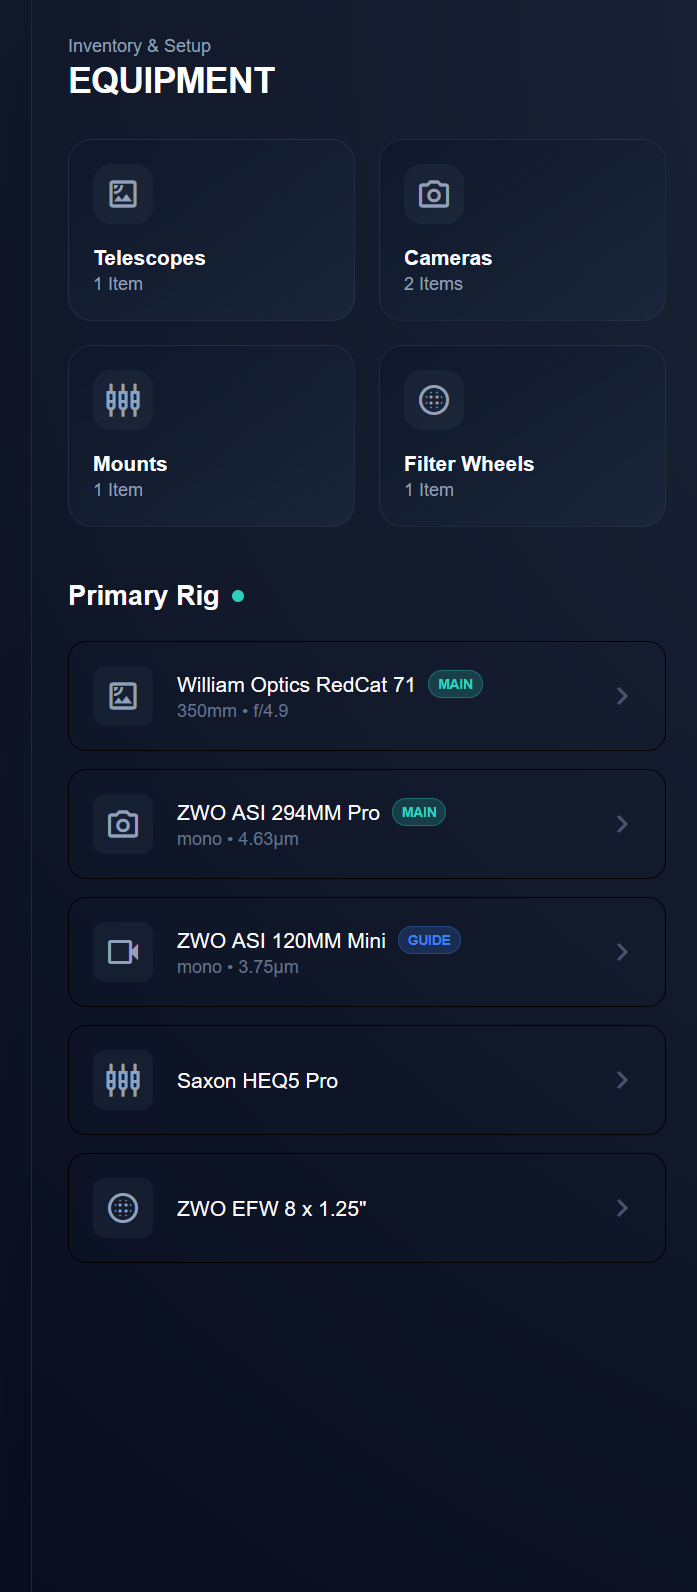
Equipment Management
Build and manage your complete imaging rig in one place. Telescopes, cameras, mounts, and filter wheels, each with detailed specs, role assignments, and a dedicated Primary Rig view. Swap between setups and always know exactly what configuration captured each session.
Your data stays yours
Every session, target, and equipment profile you create belongs to you. Export your data anytime with a full download of your imaging history. No lock-in, no data mining, no sharing with third parties. Your observations are yours to keep.
Simple, Powerful Pricing
Everything you need for your observatory, in one pro plan.
Start with a 7-day free trial
Cancel anytime.
Development Roadmap
Our upcoming orbital trajectory for StellarLog.
Desktop Support
Adapt the mobile-first interface for larger screens. On medium breakpoints and above, the bottom navigation will be replaced with a persistent sidebar. Pages will use multi-column layouts, the dashboard will show more data at a glance, and list views for equipment, sessions, and targets will switch to data tables with sortable columns. This makes the app more efficient for users who plan and review sessions from a desktop or laptop.
Improved Analytics Features
Expand the home dashboard with richer data visualisations. Integration time charts will break down total hours by filter type, target, and month, giving users a clear picture of where their imaging time is going. Equipment usage stats will show which gear sees the most action, and conditions trends will plot average seeing, transparency, and moon phase over time, helping users identify patterns in their local observing conditions.
Session Streaks & Year in Review
Track consecutive imaging nights to encourage regular observing and reward dedication. A streak counter on the dashboard will show the current and longest streaks. At the end of each year (or on demand), users can generate a "Year in Review" summary showing total integration hours, number of sessions, targets completed, most-used equipment, best conditions, and other highlights from the past 12 months.
Share Cards
Allow users to generate visually appealing image cards showcasing their achievements. Cards could feature a target's DSS image alongside key stats like total integration time, filters used, equipment, and session count. These cards are designed for sharing on social media platforms and astrophotography communities, giving users a quick way to celebrate completed projects and milestones.
Batch Session Entry & Notes/Tags
Streamline logging for users who capture multiple sessions before entering data. Batch entry will allow users to log several sessions at once via a multi-row form or CSV paste, reducing repetitive input. Additionally, sessions will support freeform notes and custom tags (e.g., "test run", "windy", "new gear"), making it easier to filter and search through session history.
Import for Targets and Sessions
Enable users to bring in existing data from external sources. Users will be able to import targets and sessions via CSV or JSON files, with a mapping step to match columns to fields. This is particularly useful for users migrating from spreadsheets, other logging tools, or capture software like NINA and ASIAIR, removing the barrier of manual re-entry for historical data.
Dark Mode Scheduler
Automatically switch to night mode (red UI) at sunset based on the user's observing location. Using the saved latitude and longitude from their profile, the app will calculate local sunset and sunrise times and toggle night mode without manual intervention. This protects dark adaptation during imaging sessions and removes the need to remember to enable it each night.